Check analytics data for your UPM products
Display the number of times users access, download, or use your UPM product.
阅读时间3 分钟最后更新于 2 个月前
To learn how many users interact with your UPM products, go to the Analytics section of the Publisher Portal.
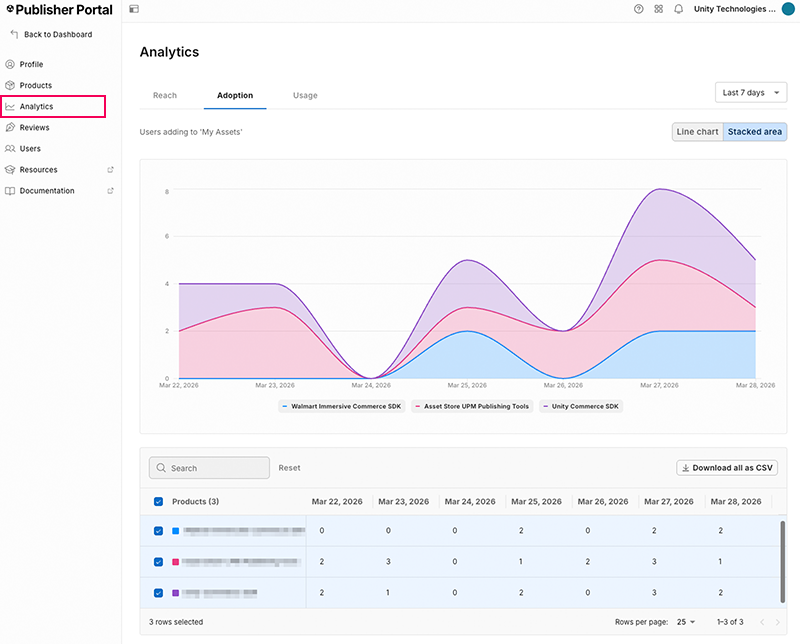
The Publisher Portal analytics window in the adoption group view.
Analytics group | Description |
|---|---|
| Discovery | The number of page visits to the UPM product details page (PDP). |
| Acquisitions | The number of paid sales for the product, and the gross revenue those sales generated. |
| Usage | The number of Unity Editor installs over time, installs by Unity version, and installs by package version. |
View summary metrics
Each analytics group displays summary tiles above the chart. Each tile shows a metric name, its current value, and how the value has changed compared to the previous period. Select the Info icon next to a metric name to view a description of that metric.
View usage breakdowns
In the Usage group, select an option from the By dropdown to change how the Package Installs chart groups install data.
Breakdown | Description |
|---|---|
| Unity Version | Groups installs by the version of the Unity Editor that installed the package. |
| Package Version | Groups installs by the installed package version. |
| Installs over time | Displays installs as a time series across the selected date range. |
When you select Unity Version or Package Version, the chart changes to a donut chart for each selected package. Use the Packages list below the chart to choose which packages to display, and select the arrow (>) next to a package to view its breakdown in more detail. Hover over a segment of a donut chart to view the exact percentage it represents.
Change the analytics graph view
The analytics graph has the following chart views depending on the metric you select:
- Line chart: Displays each product's data over time in a separate line.
- Stacked area: Displays the combined total of all products over time, and how much of the total belongs to each.
- Donut chart: Displays difference in total metrics.
In the Discovery group, use the Chart metric dropdown to select the metric the graph displays. In the Acquisitions group, use the Chart metric dropdown to switch the graph between Product Sales and Gross Revenue.
Hover over a point on the graph to view a tooltip with the exact value for each visible product or package on that date.
To display product data in the graph, select the checkbox next to a product name. There’s no limit to the number of products you can display in the graph.
Enter a product or package name in the Search field to filter the table rows below the graph. Select Reset to clear the search and restore all rows.
Select the date range dropdown to change the period of time displayed in the graph.
Download usage data
The analytics .csv file that contains the data from the Discovery , Acquisitions, or Usage group text format as a series of strings.
To download analytics data for all projects in a specific group:
- Select an analytics group that contains the data you want to download.
- Select Download all as CSV.