Frame Debugger window reference
Explore properties and settings in the Frame Debugger window to get more information about rendering events.
Read time 1 minuteLast updated a month ago
The Frame Debugger window is the user interface for Unity's Frame Debugger. It shows the rendering event information and controls the playback of the frame under construction.
You can access the Frame Debugger window via the Game view control bar or the Window > Analysis > Frame Debugger menu.
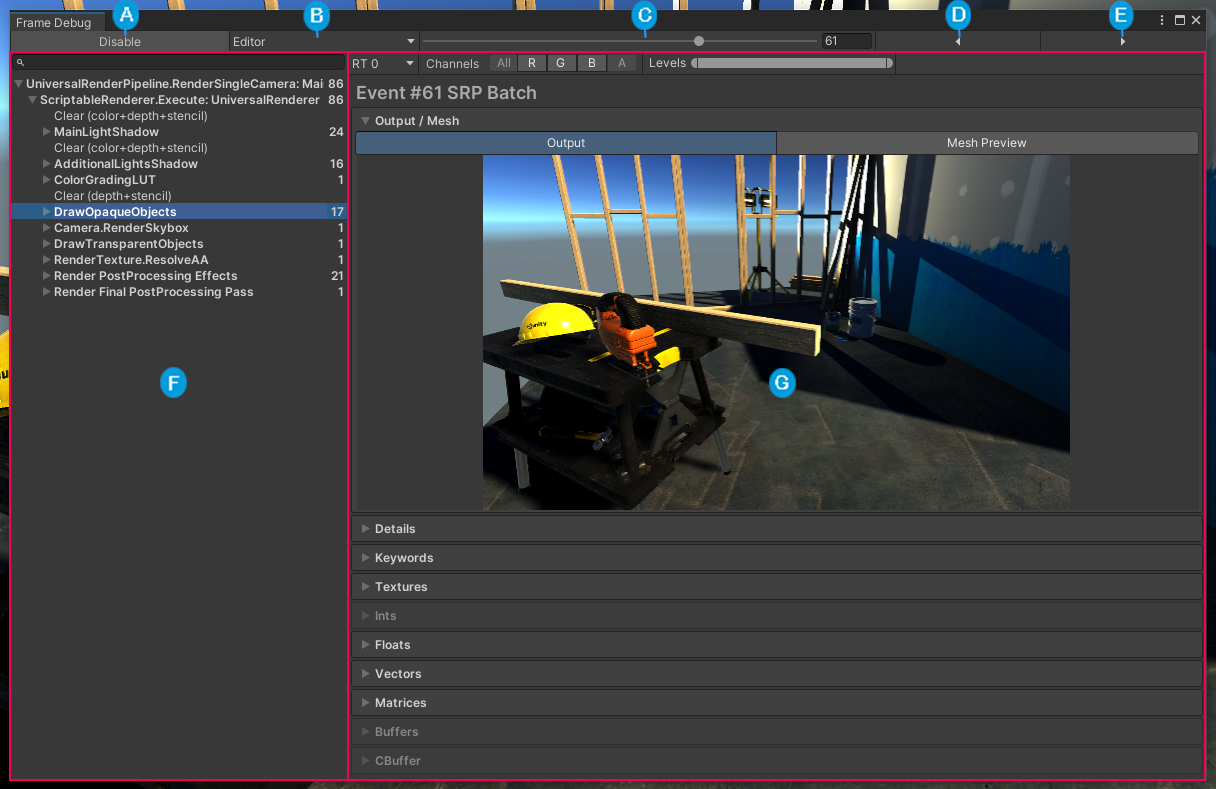
The Frame Debugger window, with the toolbar at the top (A to E), the event information panel on the left (F), and the event information panel in the centre (G).
Label | Description |
|---|---|
| A | Enable/Disable: Enables or disables the Frame Debugger. |
| B | Target selector: Specifies the process to attach the Frame Debugger to. This is the Unity Editor by default but you can use this to attach the Frame Debugger to built applications. For more information, see Attach the Frame Debugger to a built project. |
| C | Event scrubber: A slider you can use to move through the rendering events in the current frame linearly. |
| D | Previous event: Selects the event previous to the one currently selected. |
| E | Next event: Selects the event after the one currently selected. |
| F | Event Hierarchy: Lists the sequence of rendering events that constitute the frame. For more information, see Event Hierarchy. |
| G | Event Information Panel: Displays information about the event such as geometry details and the shader used for a draw call. For more information, see Event Information Panel. |