Visualization
To allow fast interaction with volumetric elements Eddy can visualize the volumes in Nuke’s 3D viewport. The controls are found in the Visualizer Settings Tab on each E_Channel node.
There are three main draw modes
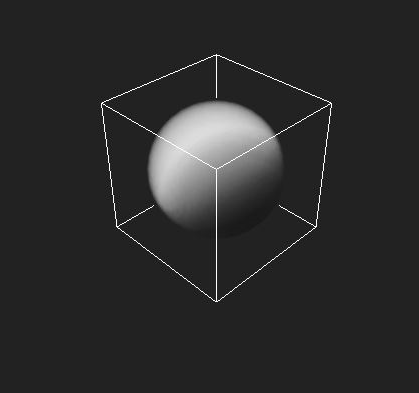
Participating Media / Fog¶ |
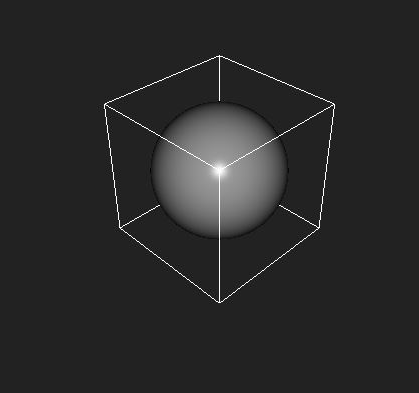
Iso Surface display¶ |
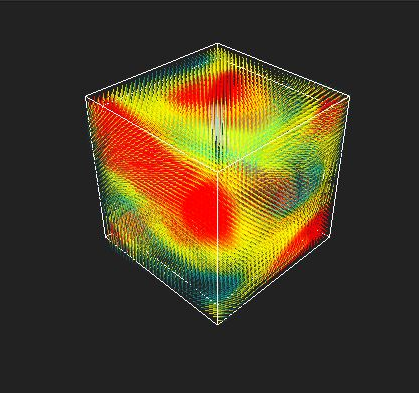
Vector Display¶ |
Only nodes that are displayed in Nuke panel will be drawn. At this stage the visualizers do not use the scene lighting or more advanced shading models.
Note
When multiple nodes are selected, Eddy will traverse the connected nodes and draw top down.
Scalar Visualizer Parameters
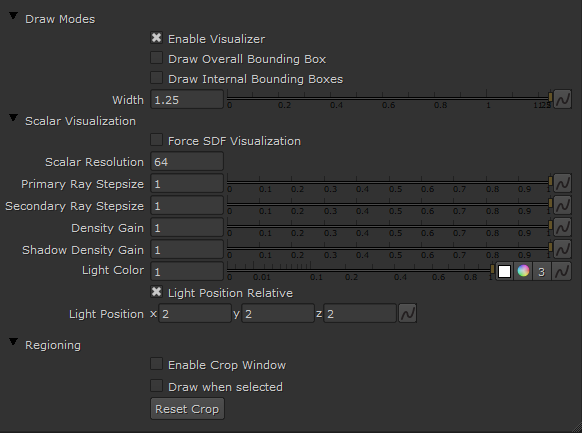
Scalar Channel Visualizer Settings
Parameter |
Values |
Description |
|---|---|---|
Enable Visualizer |
True/False |
Enables drawing |
Draw Overall Bounding Box |
True/False |
Enable drawing of the bounding box wireframe |
Draw Internal Bounding Boxes |
True/False |
Enable drawing of the active space wireframe for sparse channels |
Width |
0…inf |
Multiplier to scale the bounding box size, or sets the bounding box size when the field has no bounds |
Force SDF Visualization |
True/False |
Forced iso surface display mode |
Scalar Resolution |
1…512 |
Number of samples along the dominant axis of channel bounding box |
Primary Ray Stepsize |
0…inf |
The primary integration stepsize when integrating fog volume |
Secondary Ray Stepsize |
0…inf |
The secondary integration stepsize towards light sources when integrating fog volume |
Density Gain |
0…inf |
Multiplies the density when integrating the fog volume |
Shadow Density Gain |
0…inf |
Multiplies the shadow intensity when integrating the fog volume |
Light Color |
(0,0,0)…(inf,inf,inf) |
Color of the primary light source |
Light Position Relative |
True/False |
When enabled the light position is relative to the channel bounds, instead of being in world space |
Light Position |
(-inf,-inf,-inf)…(inf,inf,inf) |
Position of the primary light source |
Enable Crop Window |
True/False |
Enable GL corner points to adjust the visualizer draw region |
Draw when selected |
True/False |
Draw the channel when the node is actually selected in the graph view |
Reset Crop |
Button |
Reverts the crop window to the original bounding box from the channel |
Note
Eddy tries to determine automatically when to use iso or fog display depending on the input EddyChannel. However when this is ambiguous it will draw as a fog volume. For instance a signed PerlinNoise channel can be displayed in both ways.
Vector Visualizer Parameters
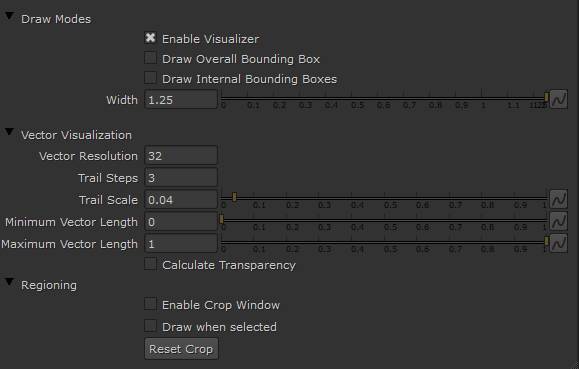
Vector Channel Visualizer Settings
Parameter |
Values |
Description |
|---|---|---|
Enable Visualizer |
True/False |
Enables the drawing |
Draw Overall Bounding Box |
True/False |
Enable drawing of the bounding box wireframe |
Draw Internal Bounding Boxes |
True/False |
Enable drawing of the active space wireframe for sparse channels |
Width |
0…inf |
Multiplier to scale the bounding box size, or sets the bounding box size when the field has no bounds |
Vector Resolution |
1…512 |
Number of samples along the dominant axis of channel bounding box |
Trail Steps |
1…15 |
Number of segments of each vector trail |
Trail Scale |
0…inf |
Length multiplier for each vector trail segment |
Minimum Vector Length |
-inf…inf |
Vector magnitudes approaching this will be at the lower end of the heatmap spectrum. Magnitudes below this limit will not be drawn. |
Maximum Vector Length |
-inf…inf |
Vector magnitudes approaching this will be at the upper end of the heatmap spectrum. Should be larger than Vector Min Length. |
Calculate Transparency |
True/False |
Enables transparency depth sorting for correct color display |
Enable Crop Window |
True/False |
Enable GL corner points to adjust the visualizer draw region |
Draw when selected |
True/False |
Draw the channel when the node is actually selected in the graph view |
Reset Crop |
Button |
Reverts the crop window to the original bounding box from the channel |
Note
Vector transparency can be useful to emphasize features in a vector channel.
Visualization Techniques
Below are a few productivity best practices when visualizing Eddy channels:
Tweaking resolution
Although our visualizers are fast visualizing a channel still takes time. At low resolution the visualization is very quick to draw but at higher resolutions drawing the visualization can be time consuming and affect how fast you can interact with Eddy. Thus in the interest of interactive performance you should avoid using higher resolution visualizers than necessary.
Visualizations do not modify channels
The visualization of a channel is just a representation of the data the channel holds. A high resolution channel can be visualized in low resolution without the visualization affecting the actual channel content in any way. This can be used to quickly evaluate the overall structure and coarse features of a high resolution channel.
Likewise low resolution data can be visualized using a high resolution visualizer. As a rule-of-thumb - if increasing the resolution of the visualizer makese little or no difference to the quality of the visualization you have reached the resolution limit of your actual channel data and there is no point increasing the visualizer resolution any further.
Note
You can always render your result to get a high fidelity view of your data.
Slicing data
The Crop Window feature is very useful to inspect regions of interest in volume data. Using a crop window you can ‘cut out’ a region of the channel so you can look at it without it being potentially obscured by what lies in front or behind the region. You can for example use a thin crop window to extract a thin slice of a channel or a small cube to extract a smaller volume.
Note
The viewer will remember the crop window shape. To reset the window to fit the current data use the ‘Reset Crop’ button - or disable the crop window.
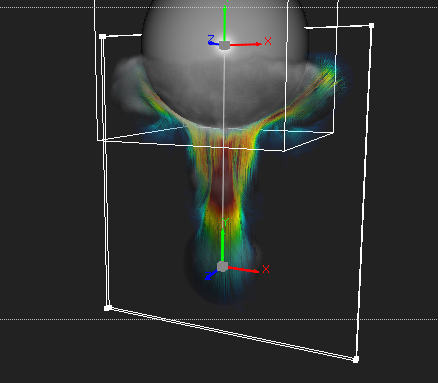
A thin slice through the velocity channel of a smoke simulation¶ |
Tweak the density gain
When visualizing dense fog volumes it can be useful to reduce the ‘Density Gain’ multiplier to make the visualization of the volume more transparent. This can help reveal internal structures and details.
Visualizing vector channels
Basic vector channel visualization can be improved by increasing the number of segments used to trace the path through space described by the vectors. This is done by increasing the ‘Vector Steps’ parameter. This can be combined with vector transparency and a fairly high visualizer resolution for a visually rich result.