在 Unity 中调试 C# 代码
通过附加External调试器并在Project代码执行时逐步查看代码来轨道脚本中的错误。
阅读时间14 分钟最后更新于 5 天前
您可以使用调试器在应用程序程序running时检查音频源代码。Unity 支持以下代码编辑器来调试 C# 代码:
- Visual Studio(带有 Visual Studio Tools for Unity 插件)
- Visual Studio Code(使用 Unity for Visual Studio Code 扩展)
- JetBrains Rider
尽管这些代码编辑器Support的调试Features略有不同,但它们All提供了Basic功能,例如断点、单一和变量检查。您可以将这些代码编辑器附加到 Unity Editor 或 Unity Player 以调试代码。
配置集成开发环境
有关配置每个受支持的集成开发环境以便在 Unity 中进行调试的要求,请参阅集成开发环境 (IDE) Support。
断点
使用断点可在代码中指定要暂停执行的代码点。在External代码Editor器中,可以ON希望调试器停止的代码线设置断点。当代码 Editor 处于断点时,可以分步骤查看变量的内容。
如果您已将代码 Editor 所挂的是 Unity Editor(请参阅将代码 Editor 附加到 Unity Editor),则在代码 Editor 中选择 Continue 选项或停止调试模式之前,Unity Editor 将失去响应。
要了解如何在 Visual Studio 中设置断点,请参阅在 Visual Studio 中设置断点。
在 Unity Editor 中调试
在 Unity Editor播放模播放模式ty EdiUnity Editor运码对其进行调试。
要在 Editor 中进行调试,必须将 Editor 的代码优化模式设置为调试模式,然后才能附加具有调试功能的代码 Editor。
要更改代码优化模式,请选择 Unity Editor 状态栏右下角的调试按钮。

The Debug Button in the bottom right of the Unity Editor Status Bar
Unity 的代码优化设置有两种模式:
- 调试模式,可用于附加 External 调试器软件,但在 Editor 中以播放模式运行项目时,C# 性能会变慢。
- 发布模式,在 Editor 中以播放模式运行项目时提供更快的 C# 性能,但无法附加 Any External 调试器。
单击状态栏的 调试 按钮When,将打开一个小弹出窗口,其中包含可使用于切换模式的按钮。该窗口还显示有关当前模式的信息,并描述切换模式时发生的情况。

The Debug Mode popup, which shows the current mode, allows you to switch modes, and describes what happens if you switch mode.
要更改 Unity Editor 的启动模式,转到 Edit(macOS:Unity)> 偏好设置 > General > 代码优化 ON Startup。

In Preferences, you can change the Code Optimization mode that Unity starts in.
要使用脚本Control这些Settings,请使用以下 API:
还可以重载 Editor 启动的模式,或关闭调试器监听套接字。为此,当您启动 Editor 时使用以下命令行参数:
- 以发布代码优化模式启动 Editor。
-releaseCodeOptimization - 以调试代码优化模式启动 Editor。
-debugCodeOptimization - 在Disabled调试器器监听套套接字的情况下启动 Editor。
-disableManagedDebugger
将代码 Editor 附加到 Unity Editor
将代码 Editor 附加到 Unity Editor 的方式取决于使用的代码 Editor,通常与代码 Editor 的法线调试过程不同。某些代码编辑器允许您选择要调试的 Unity 实例。有关代码 Editor 指定的说明,请参阅 Code Editor External 文档。要了解如何在 Visual Studio 中执行此操作,请参阅将 Visual Studio 附加到 Unity Editor。
将代码Editor所挂的 Unity Editor 并准备好开始调试When,返回回到 Unity Editor 并进入播放模式。
在 Unity Player 中进行调试
要编译 Unity Player 以供调试:
- 转到文件 > 生成配置文件。
- 启用 Player 版本之前的 和 脚本调试选项。还可以启用 Wait For Managed 调试器选项,使 Player 在执行 Any 脚本代码之前等待所挂的调试器。Development Build
?
- 选择 生成和运行。
将代码 Editor 附加到 Unity Player
要将代码Editor器附加到 Unity Player,请在代码Editor器中选择播放Player的 IP 地址(或机器Name)和端口。有关在 Visual Studio 中何处查找的示例,请参阅 Attach Visual Studio to the Unity Editor。
所挂的调试器器When,即可普通开始调试。ON 如何将 Unity Player 附加到指定的代码 Editor 的说明,请参阅 Code Editor External 文档。有关如何将移动设备上运行的 Unity Player 附加到 Visual Studio 的示例,请参阅使用 Visual Studio 调试 Android 和 iOS Devices。
在 Visual Studio 中设置断点
要在 Visual Studio 中设置断点,请单击代码左侧的柱状图 ON 要停止调试器的线。数量Next显示一个红色圆Circle,并突出显示线。

A breakpoint in Visual Studio.
将 Visual Studio 附加到 Unity Editor
要将 Unity Editor 附加到 Visual Studio 脚本,请打开 Visual Studio,转到 调试 > 附加 Unity 调试器,然后选择要调试的 Unity Editor 实例。
在以下示例图像中,有一个 Unity 实例 Editor 中running,还有一个 Unity 实例作为 Android Player running

Visual Studio lists the current instances of Unity that are available to debug.
使用 Visual Studio 调试 Android 和 iOS Devices
Android
要调试ON Android 设备上running的 Unity Player,请使用 USB 或 TCP 连接到设备。例如,要在 Visual Studio 中连接到 Android 设备,请选择 调试 > 附加 Unity 调试器选项。此时将显示running Player 实例的Devices列表。
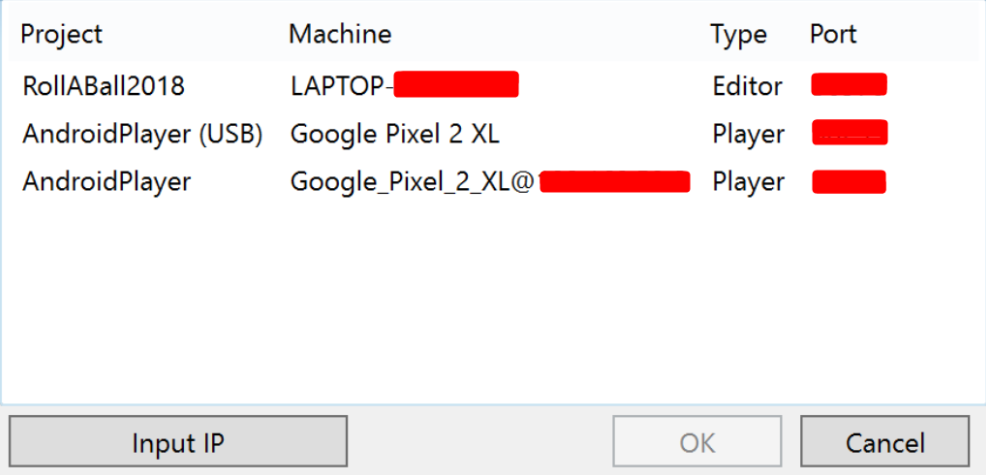
Visual Studio's Attach Unity Debugger interface displays a list of running Unity processes that the debugger can attach to.
在此示例中,Android 设备与running Unity Editor 和 Visual Studio 的工作站ON同一网络上使用 USB Wi-Fi 连接。
iOS
要调试ON iOS 设备备上running的 Unity Player,请使用 TCP 连接设备。例如,要在 Visual Studio for Mac 中连接到 iOS 设备,请选择 Debug > Attach Unity 调试器。此时将显示running Player 实例的Devices列表。

Visual Studio for Mac's Attach Unity Debugger interface displays a list of running Unity processes that the debugger can attach to.
确保设备只有一个 Active 网络接口(建议使用 Wi-Fi,关闭蜂窝数据),并且集成开发环境和设备之间没有防火墙阻挡 TCP 端口(以上截屏中的端口数量 56000)。
调试器器Troubleshoot排除
调试器的大多数问题都是因为代码 Editor 无法找到 Unity Editor 或 Unity Player。这意味着 Unity Editor 或 Player 无法正确附加调试器。由于调试器使用与 Editor 或 Player 的 TCP 连接,因此连接问题通常由网络引起。以下是您可以采取的几个步骤来 Troubleshoot Basic 连接问题。
确保将调试器附加到正确的 Unity 实例
您可以将代码 Editor 附加到本地网络上已启用调试的 Unity Editor 或 Unity Player 的任何实例。附加调试器When,请确保将其附加到正确的 Unity 实例。如果您知道运行 Unity Player 的 ON 设备的 IP 地址或 Machine Name,这有助于找到正确的实例。
验证与 Unity 实例的网络连接
代码 Editor 使用与 Unity Profiler 相同的机制来查找要调试的 Unity 实例。如果代码 Editor 无法查找所需的 Unity 实例,请尝试将 Unity Profiler 附加到该实例。如果 Unity Profiler 也找不到 Unity 实例,则运行代码 Editor 或 Unity 实例的 ON 计算机上可能有防火墙。如果已设置防火墙,请参阅 Check the firewall Settings。
确保设备只有一个 Active 网络接口
许多 Devices 具有多个网络接口。例如,移动端Phone可能同时具有Active的蜂窝连接和Active Wi-Fi 连接。要使用 TCP 将调试器正确连接到 Unity 实例,集成开发环境需要使网络连接连接到设备上的正确接口。例如,如果您计划通过 Wi-Fi 进行调试,请make将设备置于飞机模式以禁用AllOther接口,然后Enable Wi-Fi。
您可以通过查看 Player 日志来确定 Unity Player 告知集成开发环境使用的 IP 地址。查找日志的一部分,如下所示:
Multi-casting "[IP] 10.0.1.152 [Port] 55000 [Flags] 3 [Guid] 2575380029 [EditorId] 4264788666 [Version] 1048832 [Id] iPhonePlayer(Example-iPhone):56000 [Debug] 1 [PackageName] iPhonePlayer" to [225.0.0.222:54997]...此message表示 集成开发环境 将尝试使用 IP 地址 10.0.1.152 和端口 56000 连接到设备。必须可从running 集成开发环境 的计算机访问此 IP 地址和端口。
检查防火墙 Settings
Unity 实例使用 TCP 连接与代码 Editor 通信。ON 大多数 Unity 平台,此 TCP 连接发生在任意选择的端口上。普通,您不需要知道端口,因为代码Editor器应该会自动检测该端口。如果这种方法不起作用,请使用网络分析工具来确定ONrunning代码Editor器的计算机上或running Unity 实例的机器或设备上可能会阻止哪些端口。查找端口When,make保防防火墙允许访问running代码Editor器的计算机和running Unity 实例的计算机ON的端口。
验证 Managed 调试信息是否可用
如果调试器加到 Unity 实例,但断点未加载,则调试器器可能无法找到代码的Managed调试信息。Managed 代码调试信息存储在名为 .pDB 的文件中,位于磁盘上的 Managed 程序集(.dll 文件)的 Next 旁边。
当您启用正确的偏好和版本选项(请参阅配置代码 Editor)时,Unity 会自动生成此调试信息。但是,Unity 无法为Project中的托管插件Generate调试信息。仅当关联的 .pDB 文件位于磁盘上 Unity Project 中的托管插件 Next 时,才能从托管插件调试代码。
防止设备锁定
禁用用于调试应用程序程序的设备ON的Any屏幕锁定。屏幕锁定会导致调试器断开连接,并防止重新连接。在 Managed 代码调试期间不要锁定屏幕。如果屏幕锁定,请重新启动设备ON的应用程序程序,以便调试器器可以再次连接。
调试器导致的内存和线程泄漏
Managed调试器的实现将泄漏一些操作OS关卡的线程句柄和一些与线程相关的内存,Order手柄与线程启动和关闭相关的一些竞争条件。实际上,这些泄漏很小,应该不会影响应用程序的 Resource 使用。但是,When创建和销毁许多线程时,泄漏可能会很明显。此行为还可能make难以轨道实际内存泄漏,因此建议在故障内存内存When禁用脚本调试。
代码 Editor External 文档
- Visual Studio - 使用 Visual Studio 工具实现 Unity(Windows)
- Visual Studio Code - Unity Development with VS Code
- Jetbrains Rider - 调试 Unity Applications