Profiler window reference
Explore the modules and controls you can use to check your application's performance in the main Profiler window.
Read time 10 minutesLast updated 4 days ago
The Profiler window has the following areas:
- Captures list: Contains a list of saved Profiler sessions in the folder of your project.
ProfilerCaptures - Profiler modules: Add and remove modules to the window which collect different types of data related to your application. Each module has its own chart in the top half of the window.
- Profiler controls: At the top of the window there are controls which you can use to stop, start, and navigate profiling sessions.
- Module details pane: The bottom half of the Profiler window displays detailed information about the selected frame, depending on the selected module.
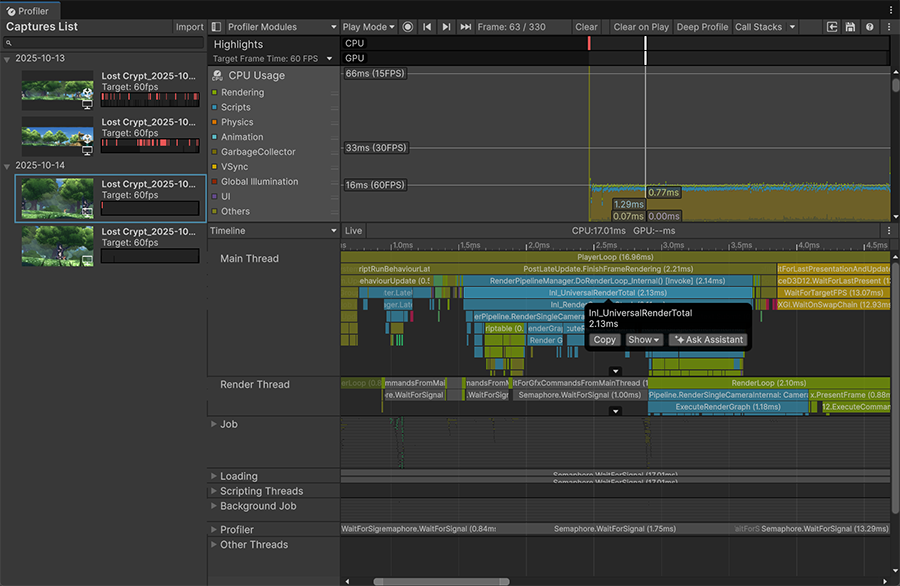
Profiler window with a frame in the CPU Usage Profiler module selected.
Captures list
When you save a Profiler capture, Unity saves it as a file to the folder of your project. You can also save files in the format with the command. The Captures List displays all the Profiler sessions in the folder. You can change the save location in the Profiler Preferences window.
.dataProfilerCaptures.raw-profiler-log-fileProfilerCapturesOperation | Description |
|---|---|
| Import | Select a |
| Context menu | Right-click on a capture to edit its details:
|
Default Profiler modules
Use the dropdown to add or remove modules to the Profiler. Profiler modules display performance data over time on a frame-by-frame basis in the charts in the top half of the window.
When you select a Profiler module its chart displays in the top half of the Profiler window. The bottom half of the window contains a module details panel which displays information related to the Profiler module selected. This area is blank when you open the Profiler for the first time, and fills with information when you start profiling your application.
For more information about how to use Profiler modules, refer to Profiler modules introduction.
The Profiler window contains the following default modules:
Module | Description |
|---|---|
| Highlights | Displays information on whether your application is meeting its target frame rate and if its performance is bound by the CPU or the GPU. For more information, refer to the Highlights Profiler module. |
| Screenshots | Displays a screenshot of your application for individual frames, synced to the Profiler timeline. This module is active by default. For more information, refer to Screenshots Profiler module. |
| CPU Usage | Displays an overview of where your application spends the most time, in areas such as physics, scripts, animation, and garbage collection. This module contains broad profiling information about your application, and you can use it to decide which further modules to use to investigate more specific issues in your application. This module is always active, even if you close it. For more information, refer to CPU Usage Profiler module. |
| Screenshots | Displays a timeline of screenshot thumbnails that Unity captures alongside profiled frames, so you can compare what's on screen with performance spikes. |
| GPU Usage | Displays information related to graphics processing. By default this module isn't active, because it has a high overhead. For more information, refer to GPU Usage Profiler module. |
| Rendering | Displays information on how Unity renders graphics in your application. For more information, refer to Rendering Profiler module. |
| Memory | Displays information on how Unity allocates memory in your application. This module is useful to investigate how scripting allocations lead to garbage collection, or how your application's asset memory usage trends over time. For more information, refer to Memory Profiler module. |
| Audio | Displays information related to the audio in your application, such as how much CPU usage the audio system requires, and how much memory Unity allocates to it. For more information, refer to Audio Profiler module. |
| Video | Displays information related to video in your application. For more information, refer Video Profiler module. |
| Physics | Displays information about the physics in your application that the physics system has processed. For more information, refer to Physics Profiler module. |
| Physics (2D) | Displays information about where the physics system has processed 2D physics in your application. For more information, refer to 2D Physics Profiler module. |
| UI Toolkit | Displays information about the time spent to render and update your UI, such as how long it takes to update runtime bindings, render, and perform layout updates. For more information, refer to UI Toolkit profiler module reference. |
| UI Toolkit Details | Displays information about the work required to render and update your UI, such as the number of batches, draw calls, and vertices. For more information, refer to UI Toolkit Details profiler module reference. |
| UI (Canvas) | Displays information about how uGUI handles UI batching for your application, including why and how uGUI batches items. For more information, refer to UI (Canvas) and UI Details (Canvas) Profiler module. |
| UI Details (Canvas) | This module's chart adds data about batch and vertices count, and markers which include information about user input events that trigger uGUI's UI changes. For more information, refer to UI (Canvas) and UI Details (Canvas) Profiler module. |
| Realtime GI | Displays information on how much CPU resource Unity spends on the Global Illumination lighting subsystem in your application. For more information, refer to Global Illumination Profiler window. |
| 2D | Displays statistics about how many sprites Unity renders and which sprite atlases it uses. For more information, refer to 2D Profiler module reference. |
| Virtual Texturing | Displays statistics about Streaming Virtual Texturing in your application. For more information, refer to Virtual Texturing Profiler module. |
| Adaptive Performance | Displays Adaptive Performance metrics, including frame timing, performance bottlenecks, CPU core configuration, and thermal warnings. For more information, refer to Adaptive Performance Profiler integration. |
| File Access | Displays information about file accesses in your application. For more information, refer to File Access Profiler module. |
| Asset Loading | Displays information about how your application loads assets. For more information, refer to Asset Loading Profiler module. |
| 2D Tilemap | Displays statistics about the tilemaps Unity renders, and how long Unity spends rendering, updating, and processing collisions for them. For more information, refer to 2D Tilemap Profiler module reference. |
| Profiler module editor (⚙) | Open the Profiler module editor to customize the Profiler modules in the list. |
| Restore defaults | Select Restore Defaults to remove any custom Profiler modules and reorder the module list to its default ordering. |
Profiler controls
The Profiler controls are in the toolbar at the top of the Profiler window. Use these to start or stop recording profiler data, and to navigate through profiled frames.
Property | Description |
|---|---|
| Target Selection dropdown | Use the Target Selection dropdown to select a platform or player for the Profiler to collect data for:
|
| Record (⏺) | Enable this setting to record profiling information for the active modules when you run your application. If Record is disabled, the Profiler doesn't collect any data when you run your application. |
| Previous frame (back arrow) | Navigate one frame back. |
| Next frame (forward arrow) | Navigate one frame forward. |
| Current frame (⏭) | When you select the Current Frame button, the frame indicator line jumps to the last recorded frame, and the Profiler enters Current Frame mode. While the Profiler collects data in this mode, it stays on the current frame and displays the data it collects in real-time. Select the button again to exit Current Frame mode. |
| Frame number | Indicates the selected frame's number. The number on the left is the current frame selected, and the number on the right is the total number of frames combined that the Profiler collected during your entire profiling session. |
| Clear | Erase all data from the Profiler window. |
| Clear on Play | Enable this setting to erase all data from the Profiler window next time you click Play in the Player window, or when you connect to a new target device. |
| Deep Profile | Enable this setting to profile all C# methods. When you enable this setting, Unity adds instrumentation to all mono calls, which then allows for a more detailed investigation of your scripts. For more information, refer to Deep Profiling. |
| Call Stacks | Select samples to record full call stacks for scripting memory allocations. Frames that the Profiler records when you enable this option have information about the selected samples on the full call stack that lead to a managed scripting allocation, even when the Deep Profiling setting isn't active. You can select the following values, and have more than one selection active at once:
|
| Load (square and arrow) | Load saved Profiler data into the Profiler window. You can also load binary profile data that the Player has written out to file via the Profiler.logFile API. Hold down the Shift button and click the Load button to append the file contents to the current profile frames. |
| Save (💾) | Save the Profiler data into a |
More (⋮) menu settings
The More (⋮) menu contains the following settings.
Setting | Description |
|---|---|
| Color Blind Mode | Enable this setting to make the Profiler use higher contrast colors in its graphs. This enhances visibility for users with red-green color blindness. |
| Show stats for "current" frame | By default, when you select the Current Frame button and enter Current Frame mode, the frame indicator line doesn't have annotations with the stats for the current frame. This is because the stats annotations might make it difficult to view data in real-time. To display the annotations, enable this setting. |
| Preferences | Open the Preferences window to adjust Profiler-specific properties. |