Analyzing Profiler traces
Export and analyze detailed Profiler trace data to identify optimization opportunities.
Read time 6 minutesLast updated 25 days ago
When you profile your application, there are some common issues that you might come across. This page outlines how to investigate the cause of some common performance issues.
Dissecting startup traces
When looking at a trace of start-up times, there are two key methods to inspect: and . These two methods are the primary places where the configuration, assets, and code of a project can impact start-up time.
UnityInitApplicationGraphicsUnityLoadApplication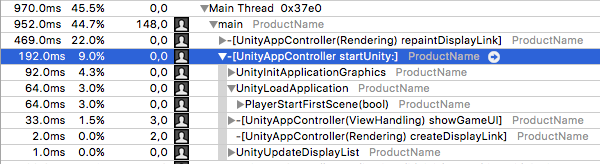
Instruments trace of an example Unity project running on an iOS device
In the above screenshot from an Instruments trace of an example Unity project running on an iOS device, in the platform-specific method, note the and methods.
startUnityUnityInitApplicationGraphicsUnityLoadApplicationUnityInitApplicationGraphicsUnity's Resource system includes every asset file in its data that's in the folder in the folder of your project. This includes any files in the folder's children folders. As such, the time required to initialize the Resources system increases in correlation with the number of files within the folders in your application's project.
ResourcesAssetsResourcesResourcesUnityLoadApplicationAwakeMonoBehaviourThese processes mean that if there is any long-running code in an callback in the first Scene of a project, that code could be responsible for slowing down the project’s initial start-up time. Resolving this involves either eliminating the slow code, or executing it elsewhere in the application’s lifecycle.
AwakeDissecting runtime traces
For profiling traces captured after the initial startup time, the primary place of interest is the method . This is Unity’s main loop, and the code within it runs once per frame.
PlayerLoop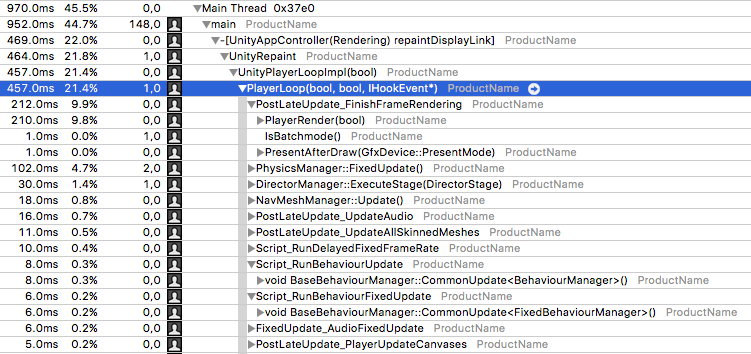
Instruments trace of an example Unity project
The above screenshot illustrates several of the most performance-impacting methods within . Note: The names of methods within the might vary between Unity versions.
PlayerLoopPlayerLoopPlayerRenderBaseBehaviourManagerCommonUpdateMonoBehaviour- calls
CommonUpdate<UpdateManager>callbacksUpdate - calls
CommonUpdate<LateUpdateManager>callbacksLateUpdate - calls
CommonUpdate<FixedUpdateManager>if the physics system has tickedFixedUpdate
In general, is the most useful method family to inspect, because it's the entry point for most of the script code running within a Unity project.
BaseBehaviourManager::CommonUpdate<UpdateManager>There are several other methods that are useful to inspect:
- invokes several different callbacks if a project uses the UGUI system. This includes Unity UI’s batch computation and layout updates; the two operations that most often cause
UI::CanvasManagerto appear in the Profiler.CanvasManager - runs coroutines.
DelayedCallManager::Update - runs the PhysX physics system. This primarily involves running PhysX’s internal code. The number of physics objects in the current Scene, such as
PhysicsManager::FixedUpdateandRigidbodyinfluence PhysX's internal code. Physics-based callbacks also appear here: in particular,ColliderandOnTriggerStay.OnCollisionStay
If the project is using 2D physics, that appears as a similar set of calls under .
Physics2DManager::FixedUpdateDissecting a script method
When scripts are invoked on platforms cross-compiled with IL2CPP, look for trace lines that contain a object. This is the point where Unity’s internal native code transitions into the script runtime to execute script code. Note: Technically, after Unity runs your C# code through IL2CPP, it also becomes native code. However, this cross-compiled code primarily executes methods via the IL2CPP runtime framework and doesn't resemble handwritten C++.
ScriptingInvocation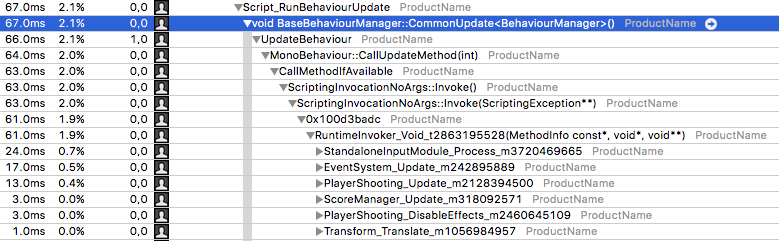
A trace from an example Unity project
In the above screenshot, the methods nested beneath the line are part of cross-compiled C# scripts that Unity executed once per frame.
RuntimeInvoker_VoidThe trace lines' names are the name of the original class followed by an underscore and the name of the original method. In this example trace, you can see , and several other methods. These are the standard Unity callbacks found in most .
EventSystem.UpdatePlayerShooting.UpdateUpdateUpdateMonoBehavioursYou can expand these methods to see which methods within them consumed CPU time. This includes other script methods within the project, Unity APIs, and C# library code.
The above trace shows that the method was ray casting through the entire UI once per frame. This method detects whether any touch events were hovering over, or activating any UI elements. The method iterating over all the UI elements, and testing whether the mouse’s position is within their bounding rectangle is resource-intensive.
StandaloneInputModule.ProcessAsset loading
You can also identify asset loading in CPU traces. The main method that indicates an Asset load is . This method connects a binary data stream from a file to Unity’s serialization system, which operates via a method named . The method is on all Asset types, such as Textures, MonoBehaviours and Particle Systems.
SerializedFile::ReadObjectTransferTransfer
Trace of a Scene loading
The above screenshot is a trace of Unity loading a Scene. When it loads a Scene, Unity reads and deserializes all the Assets within the Scene, as denoted by the calls to various methods beneath .
TransferSerializedFile::ReadObjectIf you see a performance stutter during runtime and the performance trace shows that used a significant amount of time, it means that Asset loads reduced the frame rate. Note: usually appears on the main thread when the , or AssetBundle APIs request synchronous Asset loads.
SerializedFile::ReadObjectSerializedFile::ReadObjectSceneManagerResourcesTo resolve this performance stutter can you can make Asset loading asynchronous (which moves the heavy call to a worker thread), or preload certain heavy Assets.
ReadObjectTransferCloneObjectTransferCloneObject