Dashboards
Dashboards show your most important metrics to monitor how well a game performs at a glance, through line and bar charts. These are predetermined, and you won’t be able to customize these.
There are three dashboards available that show: Game Performance, Retention, and Revenue. Dashboards can be filtered by country, version, platform, and Audience.
Game Performance
The Game Performance dashboard shows charts for:
| Daily new users | The number of players that have sent data for your game for the first time, each calendar day. |
| Daily Active Users (DAU) | The number of players active each calendar day. |
| Monthly new users | The number of players that have sent data for your game for the first time, each calendar month. |
| Weekly and monthly active users (WAU and MAU) | The number of players active in your game. |
| Session Length | The average session length when your game is played. |
| Sessions per DAU | The number of sessions per DAU. |
You can export each dashboard’s visualization as an image or CSV file. Choose your date range, and add additional filters such as country or Audience (see later section).
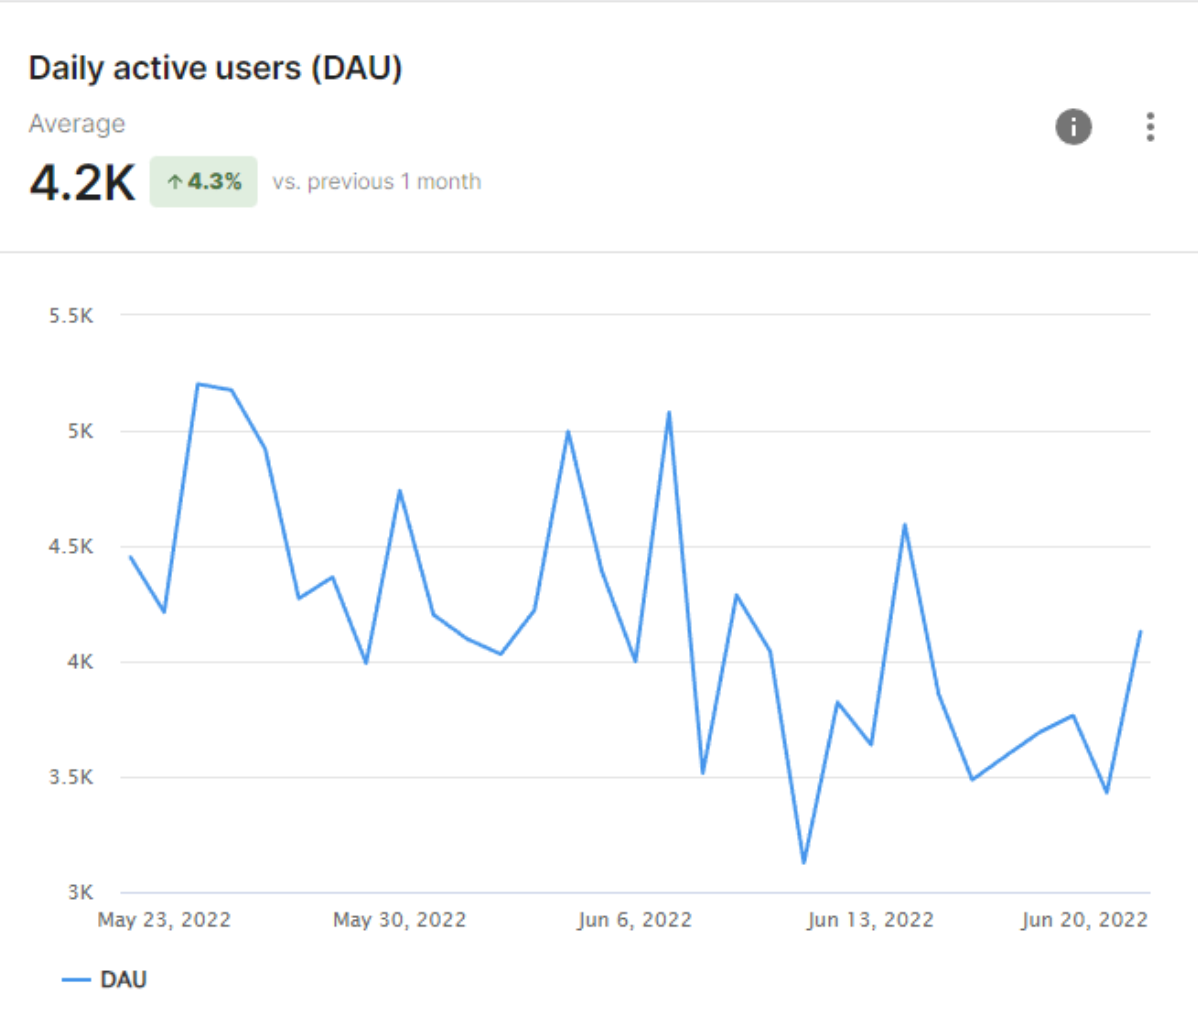
Daily active user data over time.
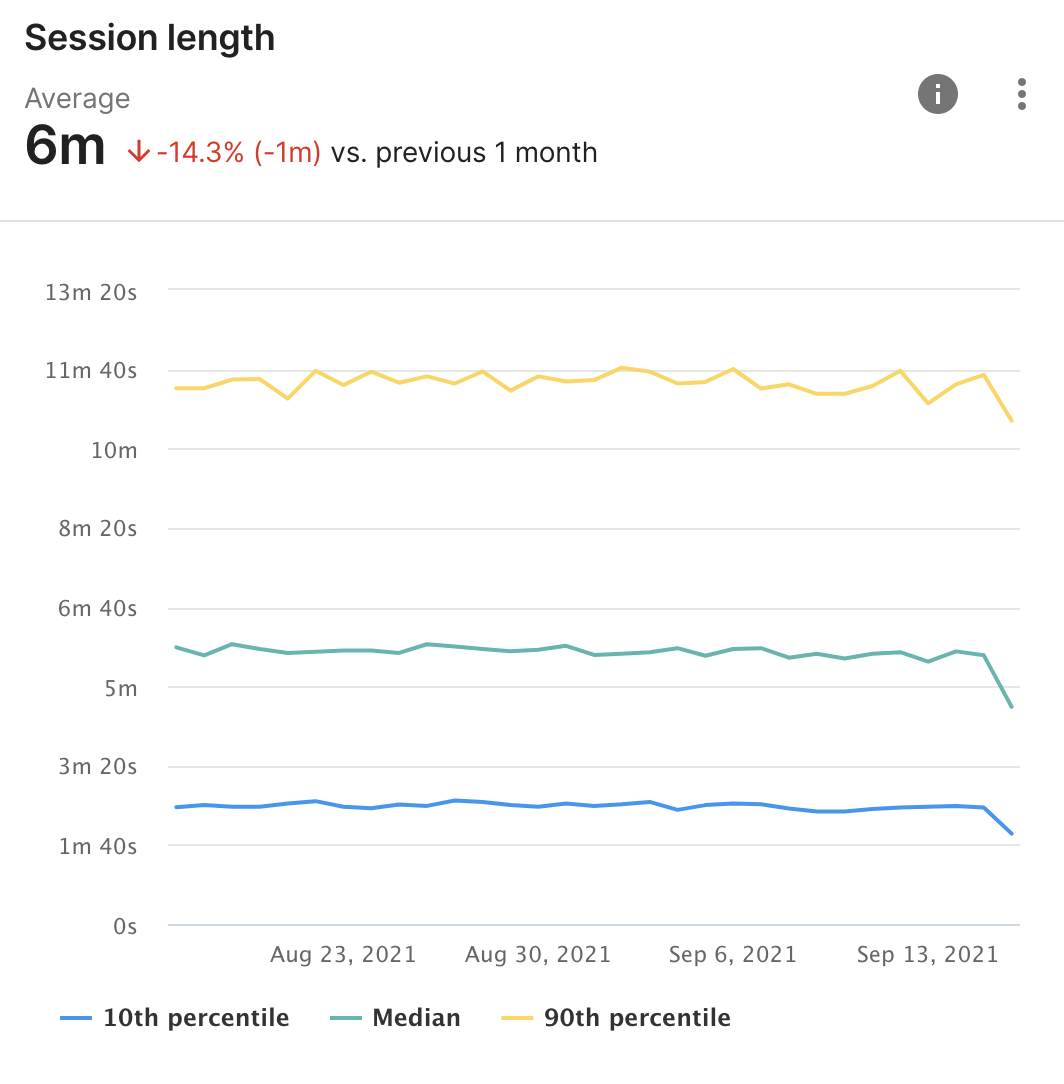
Session Length with 10th percentile, median, and 90th percentile.
Retention
The retention dashboard shows which players are still playing your game after installing. Measuring retention is useful in seeing how well your game is doing, according to the number of days it takes for a player to stop playing. A gradual curve suggests rising retention, whereas steep drops suggest players stop at a certain point in your game.
A player who sends an Event is considered active.
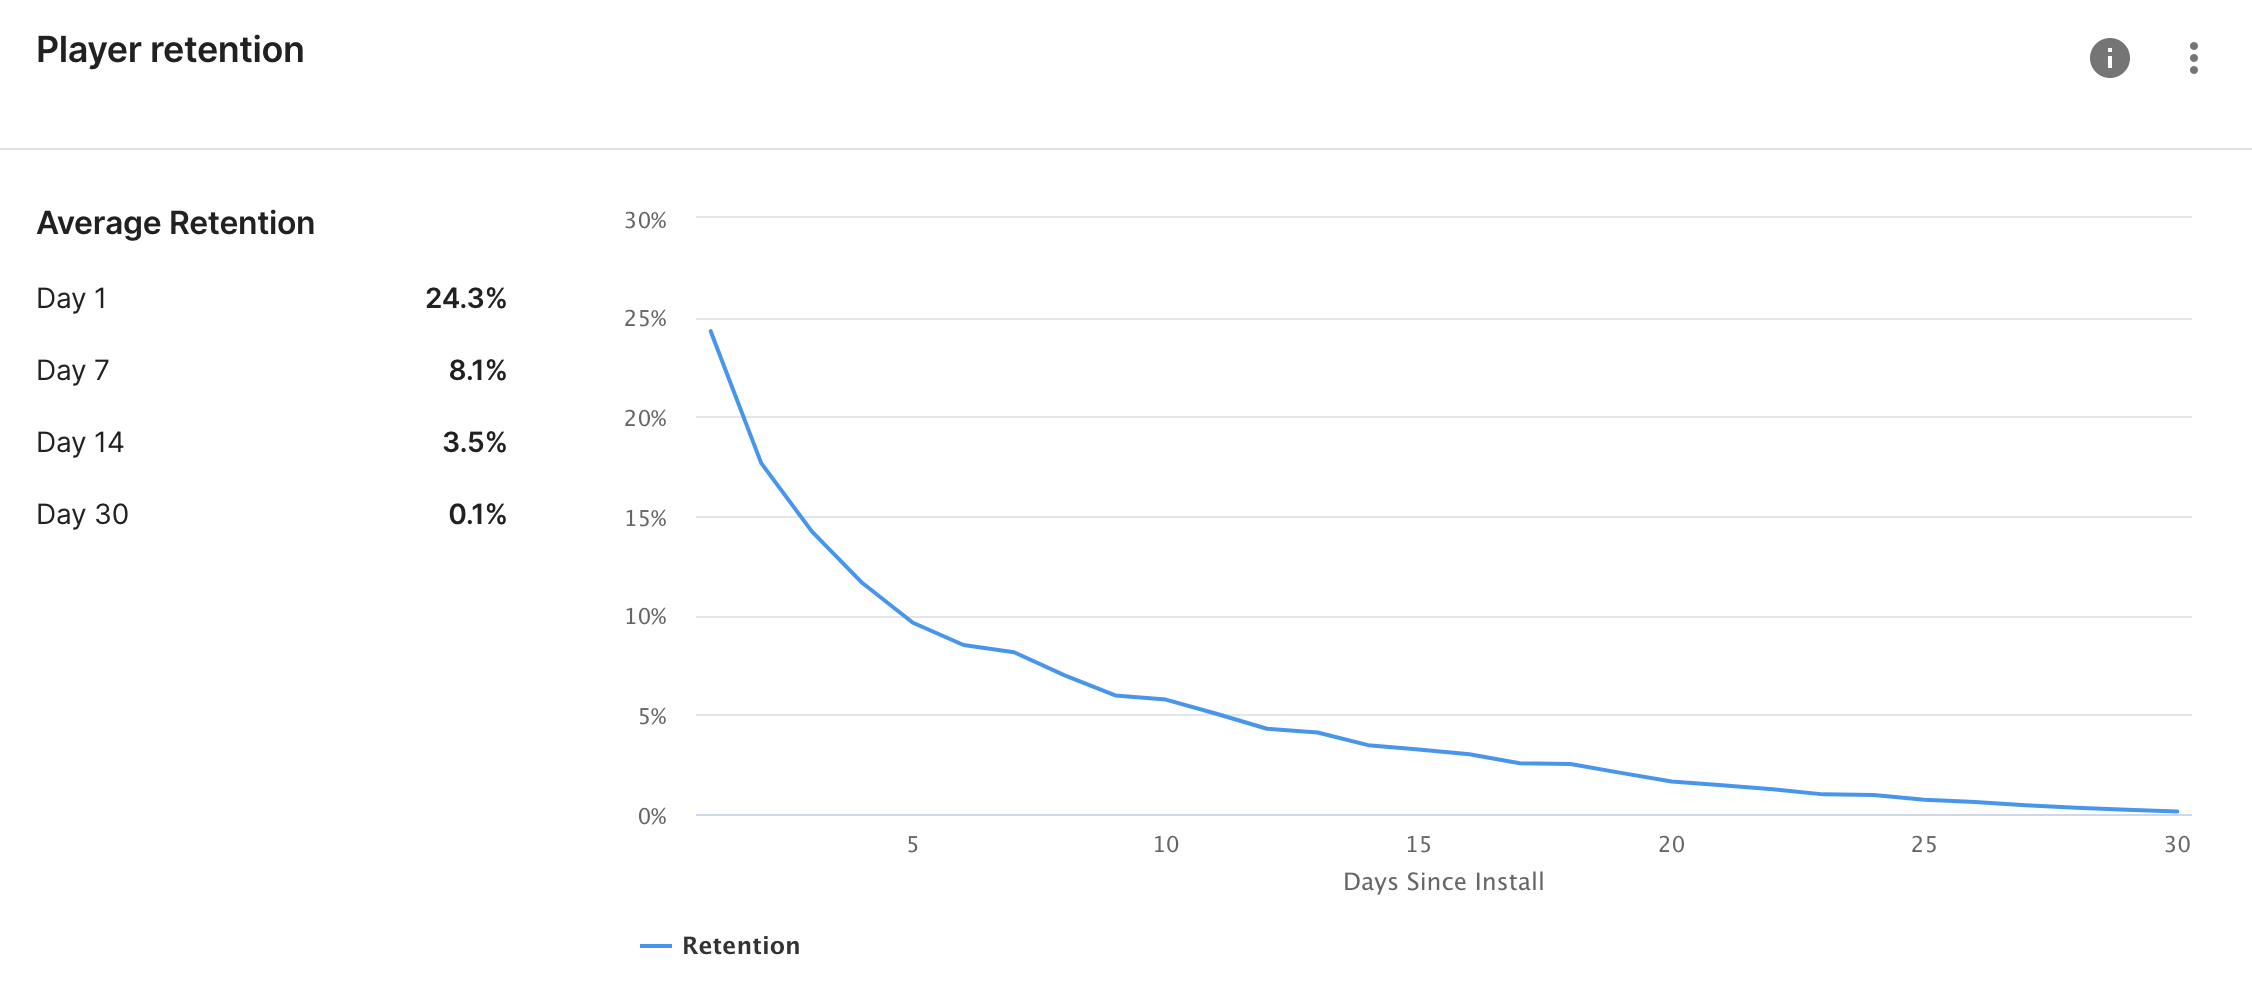
The average percentage of players playing after one day, a week, two weeks, and 30 days.
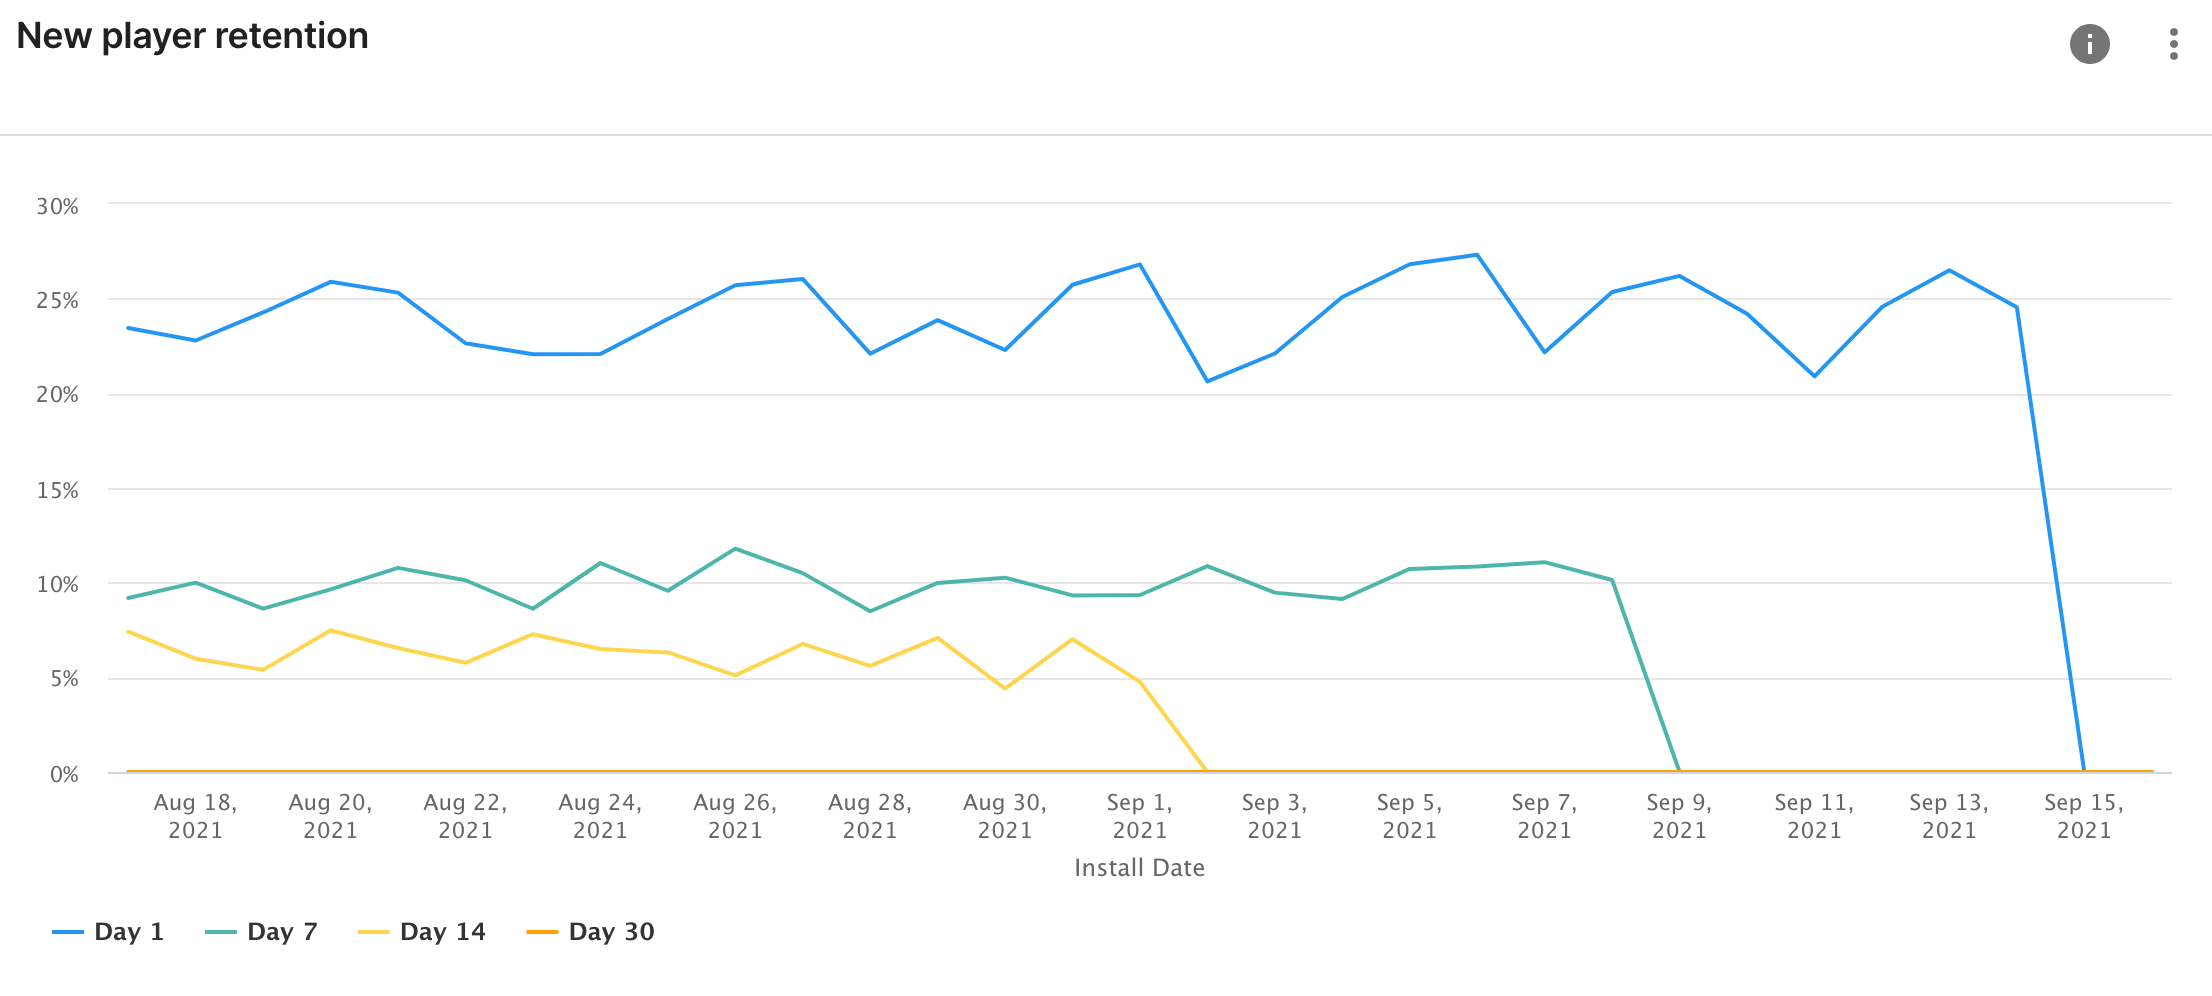
The new player retention percentages for the last day, week, two weeks, 30 days.
Note: Existing players on Legacy Analytics will be treated as new players on Analytics. Their start date will be from when you switch to Analytics, so this will cause a peak in retention metrics.
Revenue
Revenue measures the money spent in your game. The Revenue dashboard shows charts for:
| Daily Revenue | Average revenue generated by your game each day. |
| Weekly Revenue | Average revenue generated by your game each week. |
| Monthly Revenue | Average revenue generated by your game each month. |
| Average Revenue per DAU | Average revenue generated by active players each day. |
| Daily Conversion | Average in-app purchase conversion for each day. |
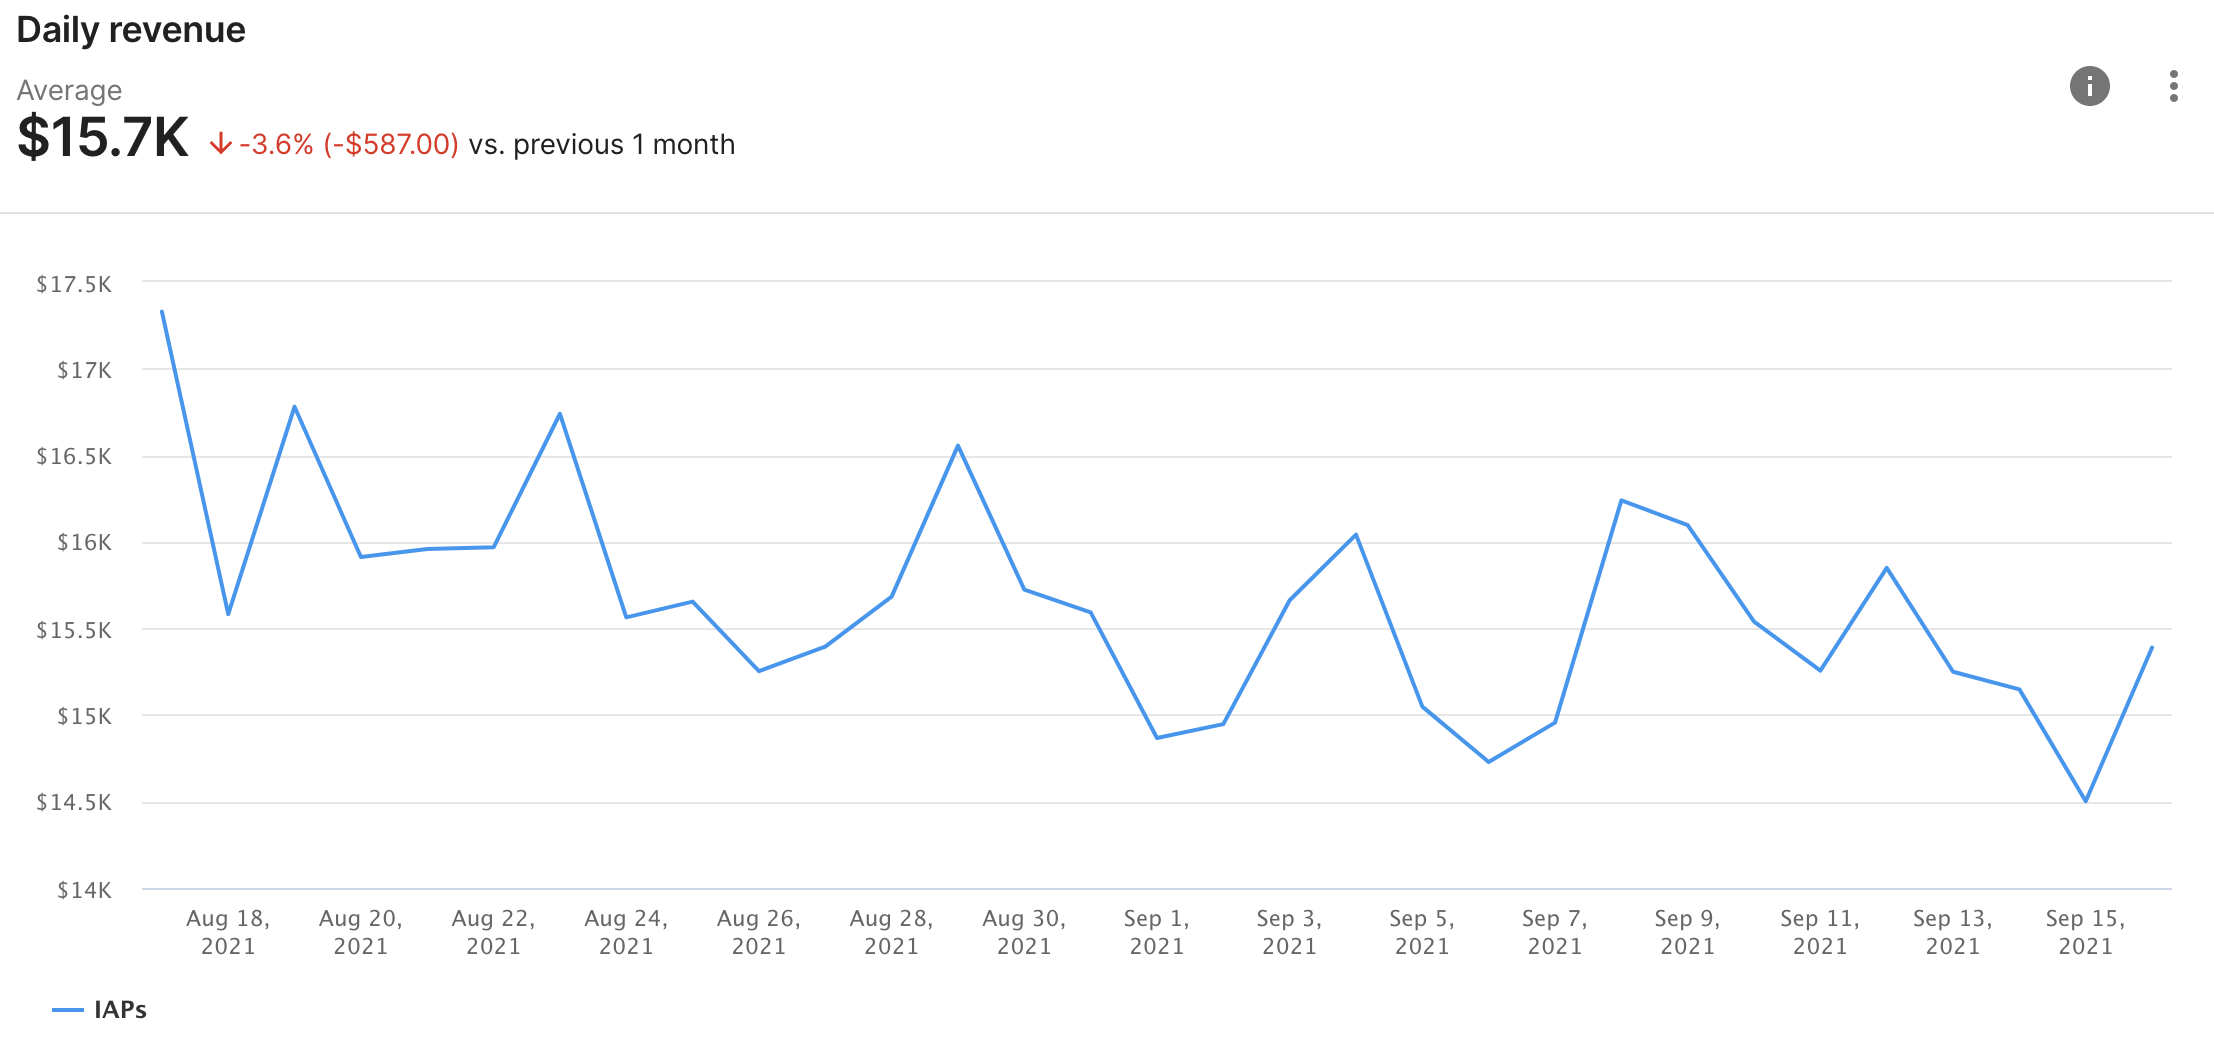
A breakdown of revenue per day, including average revenue.
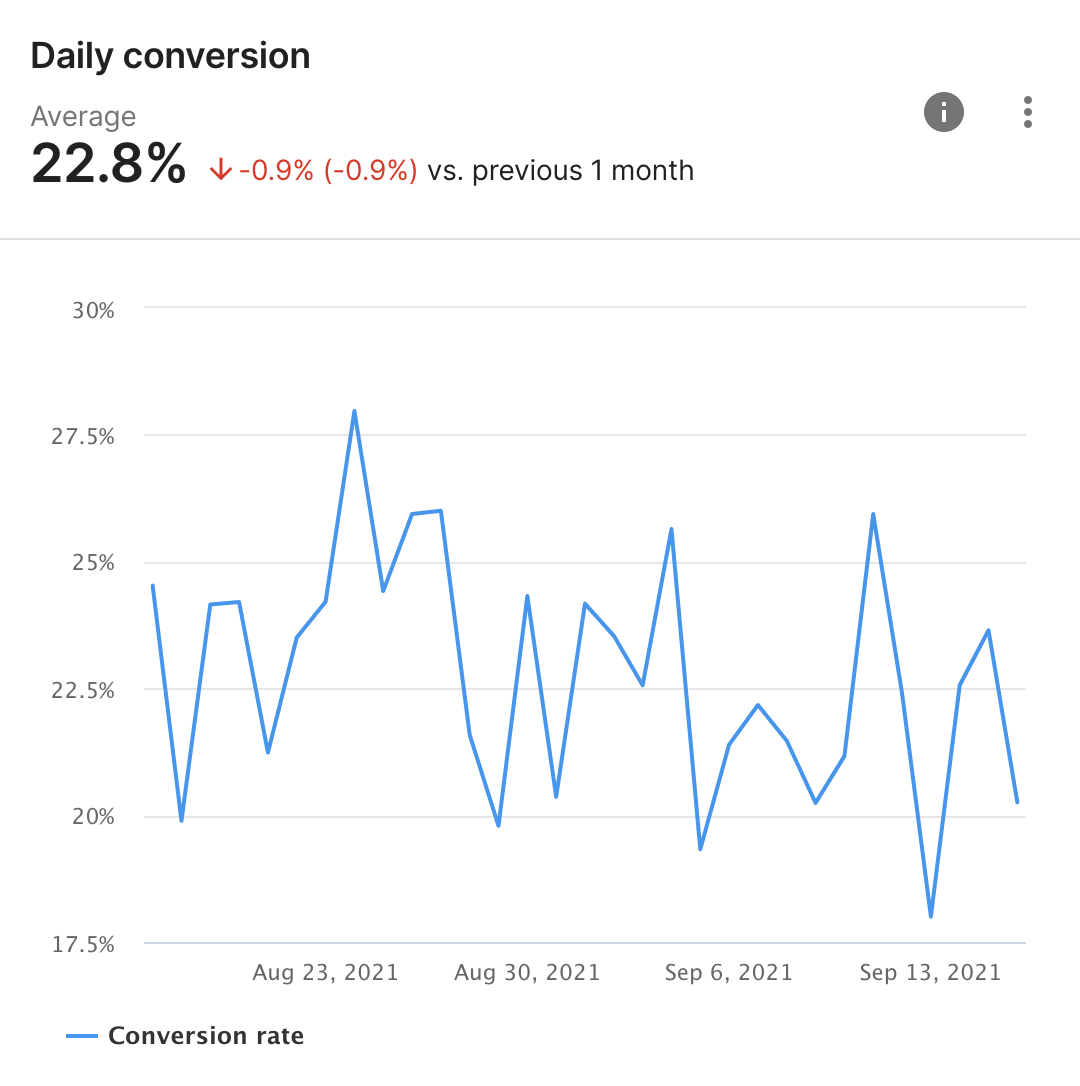
The percentage of active players who make an in-app purchase.
Attribution Support
The user acquisition dashboard shows you a breakdown of your data split by ad network provider. Use the acquisition filter at the top to choose between providers. This will show a chart that you can further filter by date range, country, platform, device version, and audience.
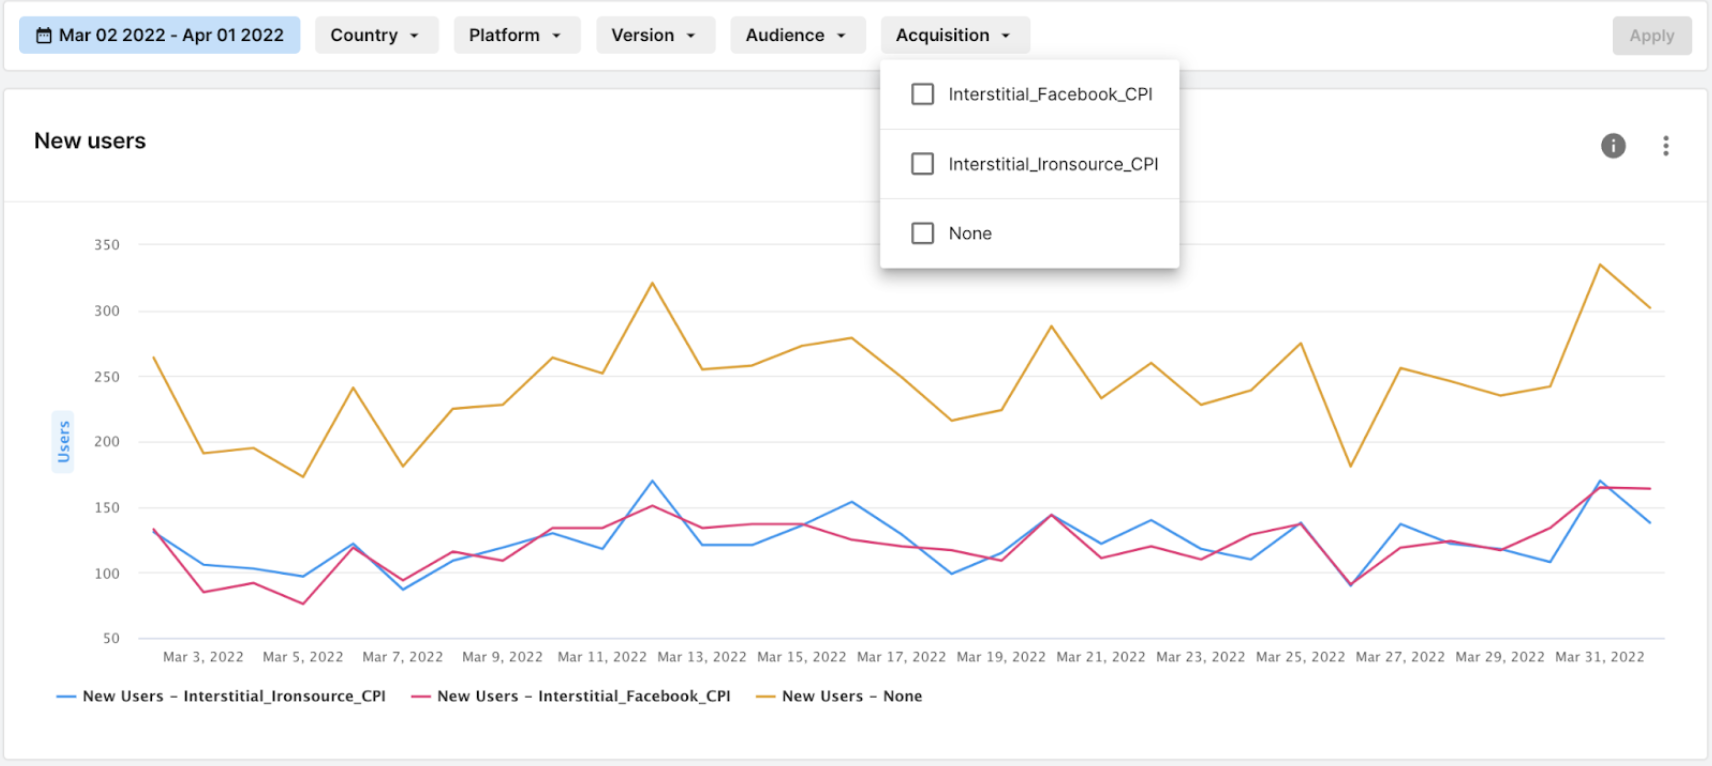
You can export your chart to an image (PNG) and CSV.