Get started with the Reporting dashboard
Access and customize the Reporting dashboard to analyze Unity Ads campaign activity by selecting date ranges, chart types, data granularity, KPIs, dimensions, and filters for tailored performance insights.
Read time 4 minutesLast updated 2 days ago
The Reporting dashboard is a customizable reporting tool in the Unity Ads User Acquisition dashboard that helps you review and analyze campaign activity. Use customizable campaign dimensions and metrics to tailor your reports based on your needs.
To access it, go to Reporting > Dashboard from the secondary navigation menu. You can configure the data displayed there in the following ways:
- Viewing options: Set the main parameters of your report using the dashboard toolbar.
- Metrics sidebar: Choose key performance indicators to review.
- Dimensions sidebar: Select data types to include in your report.
- Filter bar: Refine report data with specific filers.
Set report parameters
Use the menu bar at the top of the Reporting dashboard to define your report settings.
Select the date range
To specify the time period for your campaign data, use the date range dropdown (calendar icon) in the toolbar. To choose the report time period, do the following:- Select the date range dropdown (calendar icon) in the menu bar.
- Choose how you want to set the time period of the report:
- Enter the date range in the two date fields.
- Select the date range using the calendar.
- Use the date range presets like Last 3 days and D0 Cohort
- Select OK to save the date range.
Choose a chart type
Choose how to display your data using the chart type icons in the menu bar. You can choose the following chart types:- Table
- Line graph
- Bar graph
Set data granularity
Choose how frequently your data points appear using the granularity dropdown (clock icon) in the menu bar. You can choose from the following granularity settings:- Hourly
- Daily
- Weekly
- Monthly
Compare date ranges
Compare your campaign performance across different time periods with the Compare toggle. To choose time periods for comparison in the Reporting dashboard, do the following:- Toggle Compare in the menu bar.
- Select Previous Period to select a comparison date range.
- Choose a time period from the available presets or enter your own dates on the calendar by selecting Custom date.
- If you choose a custom date range, select Apply to keep your selection.
Set key performance indicators
Use the Metrics sidebar to choose key performance indicators (KPIs) for analyzing your campaign performance.
Metric category | Displayable metrics |
|---|---|
| Default | Standard advertising metrics like Starts, Views, and Clicks |
| Ad Revenue | Ad Revenue and your return on ad spend (ROAS) from ad revenue |
| In-app Purchases | In-app purchase (IAP) metrics like IAP Revenue, Purchases, and IAP ROAS |
| Retention | Retention metrics like Retention rates and total Retained |
| Return on Ad Spend | Total return on your advertising costs |
| Event optimization | Event metrics like Registrations, Level Complete Rates and Event completions |
- D0 (day-zero)
- D1 (day-one)
- D3 (day-three)
- D7 (day-seven)
- D14 (day-fourteen)
- D21 (day-twenty-one)
- D28 (day-twenty-eight)
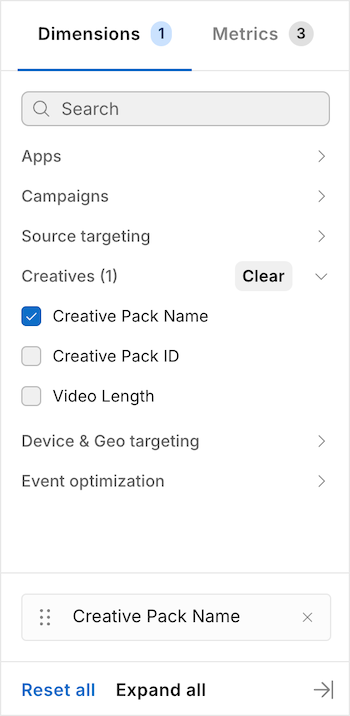
Select report data types
Choose the kind of data you want to include in your report with the Dimensions sidebar. Choose from the following kinds of dimensions to add data to your report:Dimension type | Data added |
|---|---|
| Apps | App data like App Name and Game ID |
| Campaigns | Campaign data like Bidding Strategy and Campaign Name |
| Source Targeting | Source app data like Source App Category and Source App ID |
| Creatives | Creative pack data like Creative Pack Name and Video Length |
| Device and Geo Targeting | User device data like Country and Platform |
| Event Optimization | Event data like Event name and Event Name Targeting |
Refine data
Refine what data you include in your dashboard report using filters. To add filters to your report, do the following:- Select Add filters in the menu bar.
- Select filters from the list or use the search bar to search for specific filters.
- Select Apply to keep your selections.